The area of set visual analytics (SetVA) deals with the problem of representing sets of elements visually, drawing such representations, and interacting with them for analysis by a human user. With a wide range of applications from biosciences to digital humanities, interest in this area has grown substantially over the past decade. Recent and upcoming Dagstuhl seminars delve into scalability and dynamic set representation. SetVA broadly has its origins in the logic and diagrams communities, with the oldest workshop on the topic, Euler Diagrams/SetVR, founded by this community as well. Due to the prevalence of such data in real-world applications and the need to visualize this information, the visualization and visual analytics communities have developed interactive representations for this type of data. Simultaneously, the areas of computational geometry and graph drawing have studied and continue to study combinatorial and algorithmic problems associated with set representations and their complexity. Application areas have also investigated how to represent this information independently
Given this cross-disciplinary interest in the topic, we are organizing a half-day IEEE VIS workshop, bringing together a number of communities to discuss and create new research on this topic to the mutual benefit of the various communities.
To inspire this discussion, the workshop features three invited speakers to provide different perspectives on set visualization, as well as lightning talks and ample room for discussion.
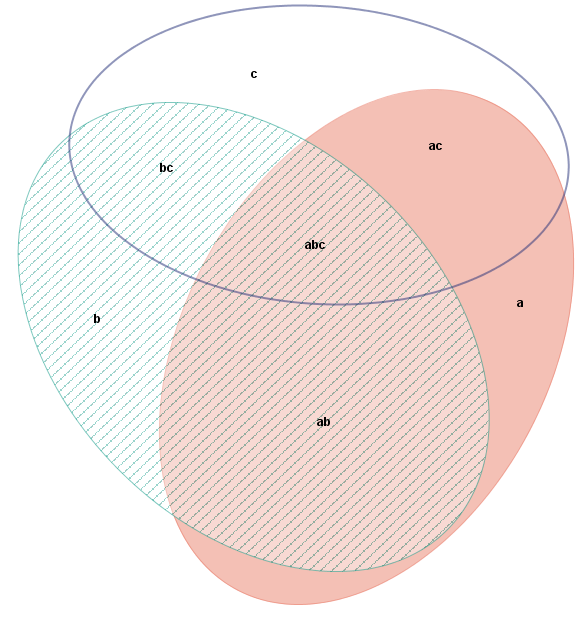
EulerAPE (Courtesy of Peter Rodgers) 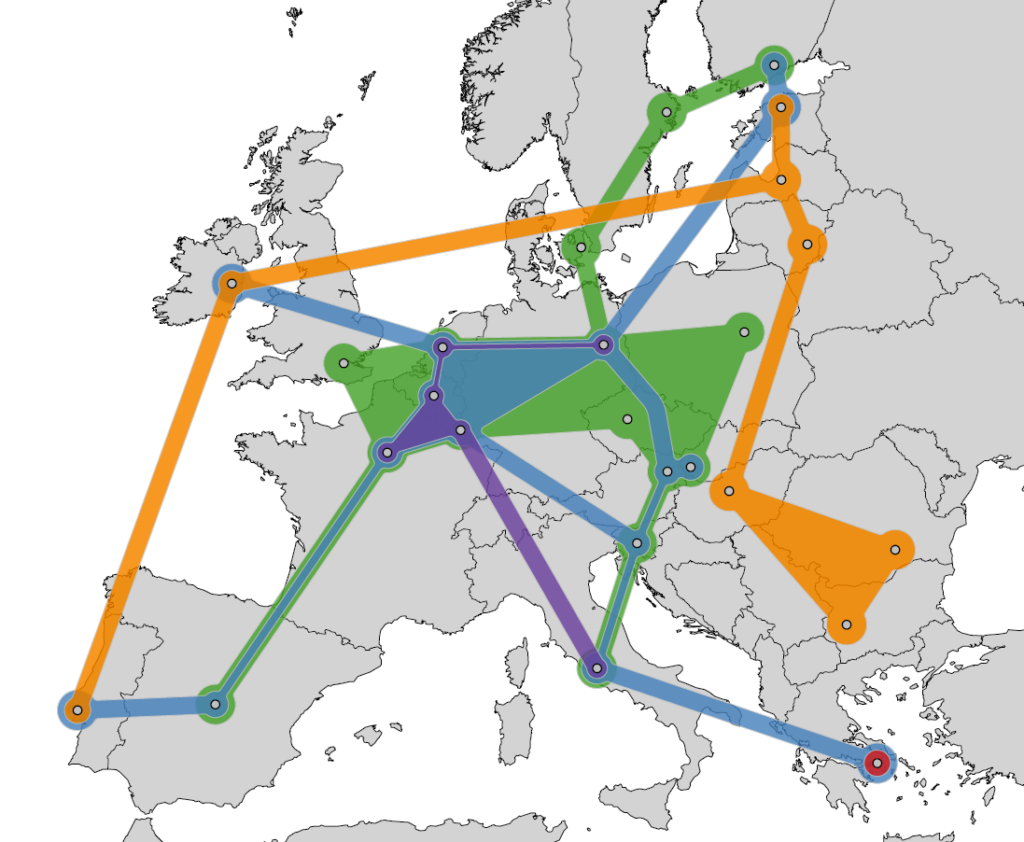
KelpFusion 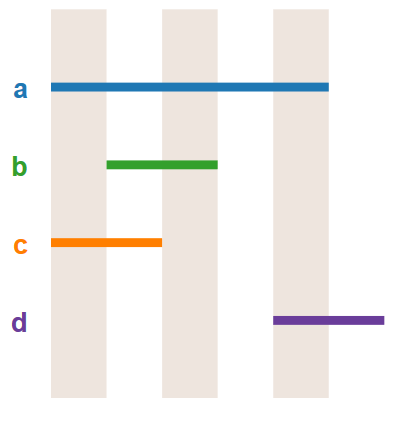
Linear Diagram (Courtesy of Peter Rodgers) 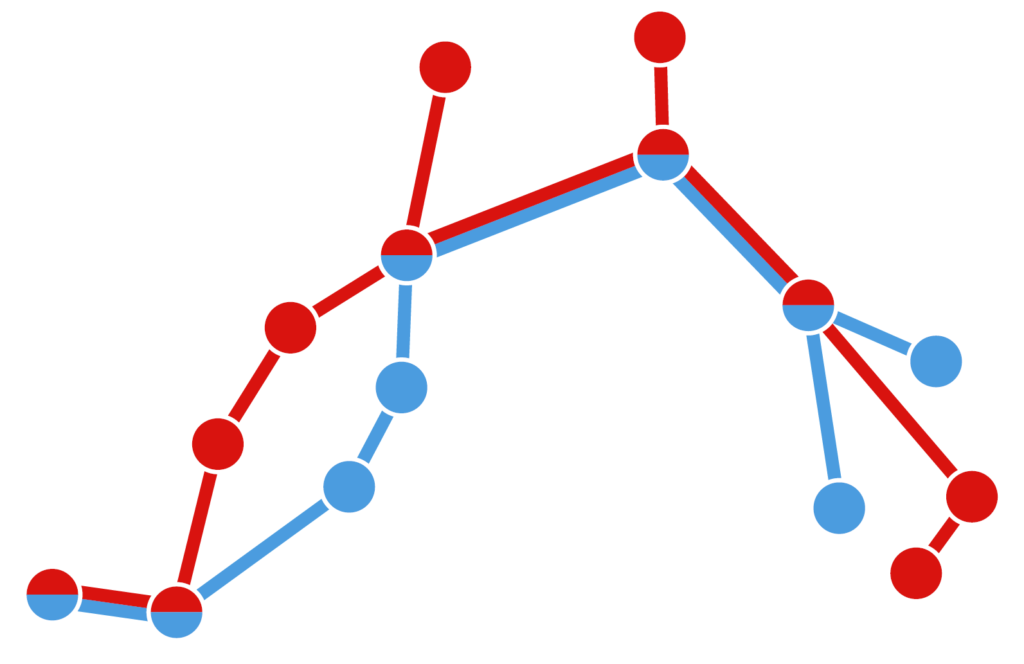
Shortest plane support 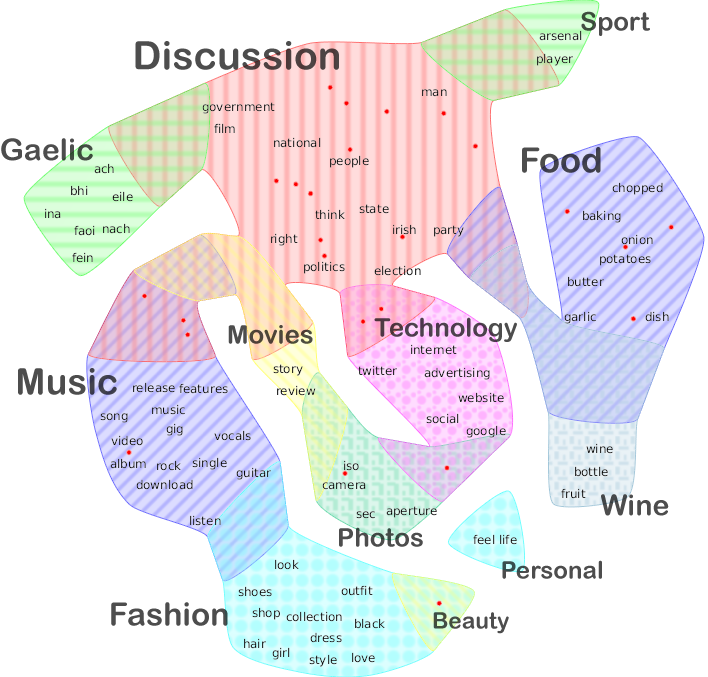
(Courtesy of Daniel Archambault) 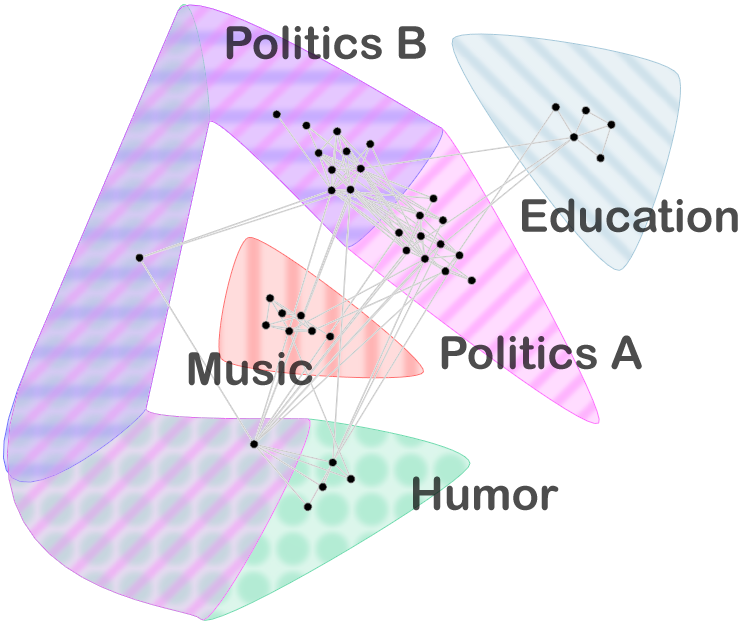
(Courtesy of Daniel Archambault)